
Special Issue:
Veterinary Medicine between Sustainable Development and Public Health to Confront Global Changes
Technical Efficiency and Total Factor Productivity Changes of Dairy Production Sector in Egyptian Governorates: DEA Approach
Mohamed A. Omar, Fardos A.M. Hassan, Sara E. Shahin, Marwa El-Shahat*
Veterinary Economic and Farm Management, Department of Animal Wealth Development, Faculty of Veterinary Medicine, Zagazig University, Zagazig, Egypt.
Abstract | The goal of the study is the estimation of the technical and scale efficiency as well as total factor productivity of cow breeds in the Egyptian governorates during the period from 2018 to 2020 using the DEA approach (output-oriented model) based on panel data collected from Central Agency for public mobilization and statistics. The results showed that the mean technical efficiency score estimated under CRS and VRS assumptions was 0.756 and 0.859, respectively. Implying that according to CRS assumption, production could be rise by 24.4% with already existing resources without need to increase the amount of inputs and according to VRS assumption, production could be rise by 14.1% with increase the amount of resources. Furthermore, average of scale efficiency was 0.892. Therefore, governorates could raise their production by roughly 10.8% if they adjust their scale of production and operate under appropriate scale. Regarding the Total Factor Productivity, the average was 0.893. All governorates in Egypt showed decline in productivity except Cairo, Alexandria, Port- said, Gharbia, Menofia, Behira, Sohag, Qana and Aswan.
Keywords: Technical efficiency, Total factor productivity, Scale efficiency, DEA, Dairy
Received | September 04, 2024; Accepted | October 11, 2024; Published | October 26, 2024
*Correspondence | Marwa El-Shahat, Veterinary Economic and Farm Management, Department of Animal Wealth Development, Faculty of Veterinary Medicine, Zagazig University, Zagazig, Egypt; Email: [email protected]
Citation | Omar MA, Hassan FAM, Shahin SE, El-Shahat M (2024). Technical efficiency and total factor productivity changes of dairy production sector in Egyptian governorates: DEA approach. Adv. Anim. Vet. Sci. 12(s1): 294-301.
DOI | https://dx.doi.org/10.17582/journal.aavs/2024/12.s1.294.301
ISSN (Online) | 2307-8316; ISSN (Print) | 2309-3331
Copyright: 2024 by the authors. Licensee ResearchersLinks Ltd, England, UK.
This article is an open access article distributed under the terms and conditions of the Creative Commons Attribution (CC BY) license (https://creativecommons.org/licenses/by/4.0/).
INTRODUCTION
Food security is a problem that affects the entire world, but it is especially important in the developing countries. Milk and its products are important because they are high in nutrients and contain many essential elements that the human needs, like protein, minerals, and vitamins (Fawaz et al., 2017). In Egypt, the dairy industry accounts for almost one-third of the total agricultural value of the country. In 2015, livestock production contributed by about 73.5 billion Egyptian pounds to the national economy, representing 2.2% of the gross domestic product, with 23% of that coming from milk production (FAO, 2017). The growth of milk production in Egypt is critical given the country’s growing population and rising demand for dairy products (Ghoneim et al., 2018). The milk represents the highly daily per capita protein consumption for the Egyptian people, accounting for around 7.4 grams (or 28.8%) of the average daily per capita from animal protein (Ministry of Agriculture and Land Reclamation, 2014). Egypt’s domestic raw milk production weight increased by 10.5% from 5547 thousand tons in 2020 to 6165 thousand tons in 2021 (CAPMAS, 2021a). Average per capita from milk production in Egypt was of 59.8 kg and self-sufficiency ratio of milk was 100.40 %in 2021 (CAPMAS, 2021b).
There were several challenges that impact dairy production efficiency in Egypt, foremost among them is that native dairy breeds are not efficient milk producers, and dependence on imports has been a consequence of the inefficiency and low productivity levels. Also, market constraints like lack of extension services, milk handling and underdeveloped production systems hamper growth. In addition to, Geographic limitations and water scarcity in some regions contribute to inconsistent milk supply.
Dairy farmers use a variety of inputs, including land, labor, feed, cows, capital equipment, and managerial skills, to generate a variety of outputs, including milk and milk components fat and protein. Because of this, in order for producers to continue making a profit from milk production, they must learn to combine these inputs more effectively. The challenge for producers is to recognize the most effective combination of inputs to produce outputs (Stokes et al., 2007). Whereas maximizing outputs at a given level of inputs or minimizing inputs at a given level of outputs is what is meant by being technically efficient.
For policymakers and primary producers, efficiency is a fundamental aspect of economics, as it is the key to achieving sustainable development, it is the condition in which the highest yield for a given set of inputs is achieved. Therefore, the efficiency analysis has emerged as a critical and extensive field of research in response to the general increase in resource depletion (Hassan, 2021).
In economics, there are several methods to measure efficiency, and the two main methods are the parametric Stochastic Frontier Analysis (SFA) and the non-parametric Data Envelopment Analysis (DEAS). One of the primary benefits of the parametric stochastic frontier approach is its capacity to differentiate between inefficiency and random error (white noise). Also, It enables the construction of confidence intervals and formal statistical testing of hypotheses. The main drawback of this approach is that it need distributional assumption for the technical inefficiency term and involves a pre-specification of the functional form (Theodoridis and Psychoudakis, 2008).
In contrast, the non-parametric DEA does not need this specification of the functional form of the production function and estimates the efficiency of all decision making units (DMUs) in the absence of priori weights of inputs and outputs. However, DEA approach is deterministic and ignores noise so, all the deviations from the frontier ascribed to inefficiencies (Hassan, 2021). Subsequently both parametric and non-parametric techniques have its benefits and drawbacks. Choosing an assessment method has been controversial and primarily depends on the availability of information. In general, the non-parametric Data Envelopment Analysis (DEA) frontier is the most often used methodology in various economic and management science aspects (Begum et al., 2010). The DEA approaches were frequently utilized in several studies to evaluate the efficiency of dairy sector. Omar (2020) used DEA approach to estimate the technical efficiency of milk production for the Egyptian Governorates from 2014 to 2016, also Fawaz et al. (2017) estimated the economic efficiency of dairy milk factories in Egypt by using the DEA technique during the period (2000-2014).
Productivity can be defined as the ratio of output to input. Often, the primary goal of productivity measurement is to draw conclusions about the efficiency of a business, sector, industry, organization, or production system. However, a productivity indicator by itself does not tell us how efficiently the firm performs, without some reference point of comparison. Thus, efficiency is a relative concept. Efficiency measures a company’s performance in relation to the highest amount of realizable output that can be obtained from a bundle of inputs using a specific production technology. Consequently, improving efficiency means that the same quantity of inputs can be used to produce larger amounts of output (Lall et al., 2002).
Index numbers are used to calculate ups and downs in productivity for different periods. A common index is the Malmquist Productivity Index (MPI), which was suggested by Malmquist (1953) who defined the index number as ratios of the distance function. MPI is sometimes known as Total Factor Productivity (TFP), which can assess any progression or regression of efficiency over time, as well as any change of frontier technology in terms of progress or regress over time. Following the work of Färe et al. (1994a), MPI became a standard approach to appraise the productivity over time with non-parametric methodology, as well as it being used in a numerous studies for DEA analysis of efficiency changes for various organisations, industries and nations (Alrashidi, 2015).
Therefore, this study aimed to usage of non-parametric DEA technique to estimate technical and scale efficiencies and Total factor productivity changes of dairy production sector in the Egyptian governorates for identifying which governorates have shown the best performance adaptation during the period of study.
MATERIALS AND METHODS
Data sample
Data related to 27 Egyptian governorates between 2018 and 2020 were subjected to DEA approach. Data collected from Central Agency for Public Mobilization and Statistics (CAPMAS). Input assumptions included the number of different dairy cow breeds (Baladi, Cross and Foreign Breeds) in thousands and the total population of each governorate (million), as well as the size of each governorate (km2). While, the amount of milk (tons) produced by cows throughout various years was the output assumption.
Data envelopment analysis (DEA)
Data envelopment analysis is a nonparametric method that can be utilized to analyze the efficiency and performance of individual decision-making units (DMUs), like dairy farms (Stokes et al., 2007). In the context of DEA, an output distance function is used in a linear programming (LP) technique to envelope the data and identify the best-practice reference technology. For every farm, the technical efficiency is represented by the value derived from the output distance function (Cobanoglu, 2013).
There are two recognized approaches for the DEA process: Input-oriented (cost-oriented) and output-oriented (result oriented). Regarding the input-oriented approach, it is examined how much and which proportion the inputs should be employed to lower costs while maintaining the same level of output (Gál and Nagy, 2011); this method pays special attention to the managerial and operational concerns (Rajasekar and Deo, 2014). While, in the output-oriented approach, which is more closely related to planning and strategy, it examines how outputs might be partially increased without altering the total amount of inputs (Farrel, 1957; Charnes et al., 1978).
In this study, an output-oriented method was applied for computing the constant returns to scale (CRS) DEA and variable returns to scale (VRS) DEA measures. This is because, according to our hypotheses, we estimated the technical efficiency of milk production in terms of the governorate ability to maximize production using a certain combination of inputs. This means that in order to assess technical efficiency, the study made the theoretical assumption that production could rise to the maximum level that technology would allow.
Charnes et al. (1978) proposed DEA; established constant returns to scale (CRS) model, which assumed that each DMUs had operated at an ideal scale.
For a single output, the technical efficiency is calculated using the following linear programming model under the constant return to scale assumption (Ali and Seiford, 1993):
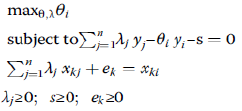
Where θi is de-noted to the rise in output level that used for input (ith) and λj refers to N × 1 vector of weights associated with inputs that is efficient, s is the slack of output, and ek is the kth slack of input.
The constant returns to scale hypothesis are suitable if the DMUs in the sample are functioning at an ideal scale, but actually, that is not how DMUs with imperfect competition operate. Banker et al. (1984) proposed a model that can cope with variable returns to scale (VRS) condition. This model is similar to the CRS model with the exception that it adds a convexity constraint (N1’λ = 1) to the model, which explains the variable returns to scale hypothesis. Banker et al. (1984) and Coelli and Perelman (1996) provide an output-oriented model, which used when the DMUs have fixed amount of resources (labour, land, livestock, capital) and aim to produce as much output as possible (milk).
An output-oriented VRS model’s formula is as follows (Shkodra et al., 2020):

Where the N1 is an N*1 vector of ones moreover 1≤ϕ<∞ and ϕ−1 is the relative rise in the level of output that could be reached by the i-th DMU, with input amounts held fixed. 1/ϕ define the technical efficiency score, which lies between zero and one.
DMU has efficient results when the values of θ and λi are equal to 1, and λj = 0. On the other hand, a result is inefficient when θ > 1, λi = 0, and λj ≠ 0. For a certain input bundle, we can obtain a measure of TE that represents the “distance” between the observed and the ideal output production:

Where, Yi and Yi are the maximum possible (optimal) outputs and the observed outputs, respectively.
The technical efficiency (TE) value derived from the DEA-CRS formulation (TECRS) can be divided into two components: Pure technical efficiency (PTE) and scale efficiency (SE) (Syarifa et al., 2020). Pure technical efficiency (PTE) removes the impact of scale size and evaluates how well a DMU uses its sources. On the other hand, scale efficiency (SE) estimates the influence of scale size on efficiency. If after employing both CRS and VRS model on the same data, there is a alteration in the two technical efficiencies, this suggests that the scale efficiency of this DMU (Mirmozaffari et al., 2017).
Scale efficiency can be computed as follows (Coelli, 1996a):
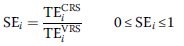
Where, SEi = 1 denotes full-scale efficiency and SEi < 1 denotes the scale inefficiency.
DEAP 2.1 program created by Coelli (1996a) was used to estimate all efficiency measures.
The malmquist total factor productivity (TFP) index
When panel data is available, DEA enables us to estimate the Malmquist Total Factor Productivity (TFP) index which measures productivity changes over a period (Berg et al., 1992). TFP breaks down into four components: (1) technical efficiency changes (related to constant returns-to- scale technology), (2) technological changes, (3) pure efficiency changes (related to a variable returns to scale technology) and (4) scale efficiency changes (Coelli, 1996b). Technological change is known as the “innovation” component it captures sectorial changes in technology at the national level. On the other hand, efficiency change is sometimes referred to as the catching-up component since it shows the distance a subsector has to go to reach the production frontier. In other words, the change in output that can be attained at any level of input is represented by technological change. While, efficiency change refers to a DMU’s ability to realize its potential through the application of current knowledge and technology (Lall et al., 2002; Nin-Pratt et al., 2012; Tirkaso and Hess, 2018).
Fare et al. (1994b) identifies an output-based TFP as follows:

Where xt + 1 is the production point for x1 and yt + 1 refers to the production point for y1. The M0 represents the mean (geometric) of the two output-based on Malmquist TFP that defined by the period t and period t + 1 technology. When M0 > 1 will indicate growth from the period t to the period t + 1 and progress for the productivity and when M0 < 1 will refer to growth from the period t to the period t + 1 and regression for the productivity. When M0 = 1 will refers to constant growth from the period t to the period t + 1 for the productivity, The four parts of TFP change mentioned above are measured using separate linear programming models comparable to those used for computing the TE measures (Coelli, 1996b).
In the following equation, the term inside the brackets refers to the technological change and ratio outside the brackets refers to efficiency change.

The two observations (xt, yt) and (xt+1, yt+1) are compared to their corresponding production frontiers by the efficiency change component. St and St+1 measure whether production is catching up with or falling behind the production frontier. The technological change term captures changes in technology at the national level (Abed and Acosta, 2018).
RESULTS AND DISCUSSION
The results in Table 2 revealed that, under the CRS hypothesis, the mean technical efficiency for all governorates was 0.756. This indicates that due to resource misallocation, milk production was lost by approximately 24.4% and governorates could still increase milk production by the previous percentage (24.4%) using already-available resources without need to increase inputs. The outcomes additionally demonstrated that in accordance with the CRS hypothesis, only three governorates Kafr-Sheikh, Beni-Suef, and South Sinai were efficient in milk production. While, the remaining twenty-four governorates displayed inefficiency. These results agree with other findings that indicate TECRS was lower than 80% such as Lahmar et al. (2003) who reported that 47% of the farms are found to produce below 80 % of their potential due to technical inefficiency in Tunisia, efficiency measures suggest that state-owned farms in Tunisia could rise milk production
Table 1: Descriptive statistics of input and output variables used in DEA analysis.
|
Output |
Input |
|||
|
No of breeds (thousand) |
Size of governorate (Km2) |
Total population of each governorate (million |
||
|
Mean |
137403.79 |
122632.43 |
39601.93 |
3662389.53 |
|
Standard error |
18746.64 |
14817.80 |
10280.59 |
311012.86 |
|
Standard deviation |
168714.58 |
133360.23 |
92525.39 |
2799115.77 |
|
Minimum |
36.00 |
536.00 |
460.00 |
104800.00 |
|
Maximum |
952116.00 |
777335.00 |
440098.00 |
9947046.00 |
by up to 32% through more efficient use of their production inputs. Additionally, Theodoridis and Ragkos (2014) had estimated the mean technical efficiency level and it was 0.748 idicating that production value can be increased by 25.2% and there is significant inefficiency in agricultural activities for the dairy farms under study.
When the variable return to scale hypothesis was taken into consideration to measure technical efficiency, the average was 0.859 indicating that there was a loss in milk production of approximately 14.1% due to inappropriate resource quantity and this inefficient governorates had the potential to increase their milk production by 14.1% if they increased their resources.
According to the results, thirteen governorates Alexandria, Port-Said, Sharkia, Qalubia, Kafr Sheikh, Gharbia, Menofia, Ismailia, Giza, Beni-Suef, Aswan, and South Sinai were efficient under the VRS assumption, whereas the remaining fourteen governorates demonstrated inefficiency. These findings are align with other studies that indicate the mean of TEVRS was higher than 80% such as those of Terin et al. (2016) who reported that TEVRS was 0.87 in a study that used the DEA technique to assess the TE of 43 dairy cattle farms in Western Turkey. Furthermore, Candemir and Koyubenbe (2006) concluded that average efficiency indices under VRS assumption Was measured to be 0.832 using Data Envelopment Analysis (DEA) to analyze cross-sectional data of 2003 that involved 80 dairy farms in Izmir, Turkey, selected using the proportional sampling technique. While on other hand, there were other studies reported that the average of TEVRS was lower than 80% as those of Gul et al. (2018) who showed that the mean technical efficiency score was 0.78 based on data gathered from 148 dairy farms in areas of Adana (Turkey).
In addition, Table 2 showed that the mean scale efficiency was determined to be 0.892 suggesting that governorates might enhance their output by approximately 10.8% by modifying their production scale and functioning at a suitable scale to achieve efficiency in production. The reason for the inefficiencies in these governorates is that they may be run on a scale that is either supra- or sub-optimal. Twelve governorates had sub optimal scale and they showed an increasing return to scale efficiency indicating that their production may become more scale-efficient as the number of heads increased. While, other twelve governorates had supra optimal scale and exhibiting decreasing return to scale efficiency, these results imply that in order to achieve optimum scale, the number of heads in these governorates needs to be reduced. These results comparable with other findings who stated that the mean of scale efficiency was found to be more than 80% as results of Omar (2020) who reported that the mean of scale efficiency was 0.837 in data collected from 27 Egyptian governorate regarding dairy production.
Table 2: Technical and scale efficiency of dairy production sector among Egyptian governorates (2018-2020).
|
Return to scale |
Scale efficiency |
TE (VRS) |
TE (CRS) |
Governorate |
|
Increasing |
0.958 |
0.448 |
0.429 |
Cairo |
|
Increasing |
0.478 |
1.000 |
0.478 |
Alexandria |
|
Increasing |
0.568 |
1.000 |
0.568 |
Port- said |
|
Increasing |
0.970 |
0.691 |
0.670 |
Suez |
|
Increasing |
0.983 |
0.851 |
0.837 |
Domiatte |
|
Increasing |
0.977 |
0.941 |
0.920 |
Dakhlia |
|
Increasing |
0.755 |
1.000 |
0.755 |
Sharkia |
|
Increasing |
0.954 |
1.000 |
0.954 |
Qalubia |
|
Constant |
1.000 |
1.000 |
1.000 |
Kafr sheikh |
|
Increasing |
0.425 |
1.000 |
0.425 |
Gharbia |
|
Increasing |
0.885 |
1.000 |
0.885 |
Menofia |
|
Increasing |
0.889 |
0.96 |
0.857 |
Behira |
|
Increasing |
0.861 |
1.000 |
0.861 |
Ismailia |
|
Increasing |
0.937 |
1.000 |
0.937 |
Giza |
|
Constant |
1.000 |
1.000 |
1.000 |
Beni- suef |
|
Decreasing |
0.907 |
0.516 |
0.467 |
Fayoum |
|
Decreasing |
0.874 |
0.920 |
0.804 |
Menia |
|
Decreasing |
0.896 |
1.000 |
0.896 |
Assiout |
|
Decreasing |
0.921 |
0.629 |
0.579 |
Sohag |
|
Decreasing |
0.931 |
0.938 |
0.873 |
Qana |
|
Decreasing |
0.941 |
1.000 |
0.941 |
Aswan |
|
Decreasing |
0.993 |
0.427 |
0.424 |
Luxor |
|
Decreasing |
0.993 |
0.750 |
0.745 |
Red sea |
|
Decreasing |
0.993 |
0.798 |
0.792 |
Matrou |
|
Decreasing |
0.996 |
0.371 |
0.370 |
Wadi gdid |
|
Decreasing |
0.998 |
0.957 |
0.955 |
North Sinai |
|
Constant |
1.000 |
1.000 |
1.000 |
South Sinai |
|
0.892 |
0.859 |
0.756 |
Mean |
The findings also indicated that only three governorates were operating at their ideal scale. These governorates were Khafir Sheikh, Beni Suef, and South Sinai, all of which exhibited constant return to scale efficiency.
Regarding total factor productivity, the results in Table 3 revealed that the dairy sector in the Egyptian governorates has suffered from a regression in the productivity in the period of study. Average of TFP change was 0.893, implying that there has been a generalized technological contraction in the productivity by roughly, 0.107 and the TFP has grown by a decreasing amount. Although, there were 9 governorates showed increasing TFP as Cairo (1.565), Alexandria (1.776), Port-said (1.665), Garbia (1.770), Menofia (1.069), Behira (1.129), Sohag (1.622), Qana (1.408) and Aswan (1.379). These findings are comparable with other studies that indicate that the mean of TFP was lower than 1% such as those of Madau et al. (2017) who concluded that mean of TFP was 0.979 indicating that during the period of the study there has been a decline in TFP.
Table 3: Malmquist Index (geometric means) of dairy production sector among Egyptian governorates (2018-2020).
|
Total factor productivity change |
Scale efficiency change |
Pure efficiency change |
Technological change |
Efficiency change |
Governorate |
|
1.565 |
0.988 |
1.217 |
1.301 |
1.203 |
Cairo |
|
1.776 |
1.444 |
0.976 |
1.260 |
1.410 |
Alexandria |
|
1.665 |
1.327 |
1.000 |
1.255 |
1.327 |
Port- said |
|
0.730 |
0.996 |
0.816 |
0.899 |
0.812 |
suez |
|
0.975 |
1.008 |
1.036 |
0.933 |
1.045 |
Domiatte |
|
0.973 |
1.012 |
1.031 |
0.934 |
1.043 |
Dakhlia |
|
0.587 |
1.122 |
0.520 |
1.007 |
0.583 |
Sharkia |
|
0.908 |
1.020 |
0.935 |
0.952 |
0.954 |
Qalubia |
|
0.915 |
0.996 |
0.978 |
0.939 |
0.974 |
Kafr sheikh |
|
1.770 |
1.534 |
1.000 |
1.154 |
1.534 |
Gharbia |
|
1.069 |
0.993 |
1.000 |
1.076 |
0.993 |
Menofia |
|
1.129 |
1.037 |
1.018 |
1.069 |
1.056 |
Behira |
|
0.111 |
1.011 |
0.123 |
0.905 |
0.123 |
Ismailia |
|
0.549 |
0.603 |
1.000 |
0.910 |
0.603 |
Giza |
|
0.558 |
0.618 |
1.000 |
0.904 |
0.618 |
Beni- suef |
|
0.957 |
1.037 |
1.017 |
0.907 |
1.055 |
Fayoum |
|
0.904 |
1.065 |
0.950 |
0.893 |
1.012 |
Menia |
|
0.900 |
1.051 |
0.964 |
0.889 |
1.013 |
Assiout |
|
1.622 |
1.029 |
1.209 |
1.305 |
1.244 |
Sohag |
|
1.408 |
1.030 |
1.021 |
1.340 |
1.051 |
Qana |
|
1.379 |
1.031 |
1.000 |
1.337 |
1.031 |
Aswan |
|
0.894 |
0.640 |
1.531 |
0.912 |
0.980 |
Luxor |
|
0.971 |
0.962 |
1.126 |
0.897 |
1.083 |
Red sea |
|
0.998 |
0.991 |
1.120 |
0.900 |
1.110 |
Matrou |
|
0.340 |
0.227 |
1.641 |
0.913 |
0.372 |
Wadi gdid |
|
0.753 |
0.806 |
1.022 |
0.915 |
0.823 |
North sinai |
|
0.759 |
0.840 |
1.000 |
0.904 |
0.840 |
South Sinai |
|
0.893 |
0.933 |
0.946 |
1.011 |
0.883 |
Mean |
TFP decomposes into efficiency change and technical change. The former shows an annual contraction of 0.117, while the latter grows at an annual rate of 1.1%. The efficiency change contraction showed that most governorates are not utilizing the available inputs to their full potential. These results agree with the findings of Abed and Acosta (2018) who noted that there was a decline in efficiency change by about 0.1%. While, the technological change increases at an annual rate of 1.4%, implying that the dairy industry may not be able to reach its full potential because attempts to improve efficiency change have not been accompanied by those attempts to improve technological change.
In addition, Table 3 showed that the scale efficiency change and the pure efficiency change had an impact on TFP (both average scores are below (1) suggesting that most governorates operated under improper scale size.
Conclusions and Recommendations
The mean score of technical efficiency evaluated using CRS and VRS assumptions was 0.756 and 0.859, respectively. While, the average of scale efficiency was 0.892. In terms of total factor productivity, the average value was 0.893. The main reason for the decline in efficiency and productivity in the Egyptian governorates during the period of study was the lack of proper management and exploitation of resources. The resources were either wasted, not properly exploited, or were over used, and in all cases, this leads to a decline in efficiency and productivity. In term of technical efficiency; Kafr El-seikh, Beni-suef and south-sinai governorates were efficient under CRS assumption. While, Alexandria, Port- said, Sharkia, Qalubia, Kafr sheikh, Gharbia, Menofia, Ismailia, Giza, Beni-Suef, Aswan and South-Sinai governorates were efficient under VRS assumption. Regarding scale efficiency, Kafr El-Seikh, Beni-Suef and South-Sinai governorates showed constant return to scale efficiency and operated under optimal scale size. For the total factor productivity, all governorates showed decline in the productivity except Cairo, Alexandria, Port- said, Gharbia, Menofia, Behira, Sohag, Qana and Aswan. We recommend that specific strategies must be employed by the better- performing governorates including efficient production technique, efficiency of management and resources allocation, development of a comprehensive guide that outlines these strategies and making it accessible for underperforming governorates. Encourage underperforming governorates to invest in data collection and analysis tools to better understand their unique challenge and track progress over time. Promote collaboration between governorates through joint projects, knowledge-sharing forums, and networking events to foster a culture of mutual support and learning.
ACKNOWLEDGMENT
The authors would like to thank all members of the Veterinary Economic and Farm Management, Department of Animal Wealth Development, Faculty of Veterinary Medicine, Zagazig University, Zagazig, Egypt for their kind support.
Novelty Statement
Our study is the first study to emphasize the use of the non-parametric Data Envelopment Analysis (DEA)approach (output-oriented model) for the estimation of the technical and scale efficiency as well as total factor productivity of cow breeds in the Egyptian governorates during the period from 2018 to 2020.
Author’s Contribution
This research was conceptualized by Mohamed A. Omar. The study’s authors all participated in it. The final manuscript was read and approved by all writers.
Conflict of interest
The authors have declared no conflict of interest.
REFERENCES
Abed R, Acosta A (2018). Assessing livestock total factor productivity: A Malmquist index approach. Afr. J. Agric. Resour. Econ., 13(4): 297-306.
Ali AI, Seiford LM (1993). The mathematical programming approach to efficiency. In: Fried HO, Lovell CAK, Schmidt SS (eds). The measurement of productive efficiency: Techniques and applications. Oxford University Press, Oxford. https://doi.org/10.1093/oso/9780195072181.003.0003
Alrashidi AN (2015). Data envelopment analysis for measuring the efficiency of head trauma care in england and wales. Thesis submitted in partial fulfilment of the requirements for the degree of Doctor of Philosophy at the University of Salford Manchester Salford Business School.
Banker RD, Charnes A, Cooper WW (1984). Some models for estimating technical and scale inefficiency in data envelopment analysis. Manage. Sci., 30: 1078–1092. https://doi.org/10.1287/mnsc.30.9.1078
Begum IA, Buysse J, Alam MJ, Van Huylenbroeck G (2010). Technical, allocative and economic efficiency of commercial poultry farms in Bangladesh. World’s Poult. Sci. J., 66: 465-476. https://doi.org/10.1017/S0043933910000541
Berg SA, Forsund FR, Jansen ES (1992). Malmquist indices of productivity growth during the deregulation of Norwegian banking, 1980–89. Scand. J. Econ., 94: 211–228. https://doi.org/10.2307/3440261
Candemir M, Koyubenbe N (2006). Efficiency analysis of dairy farms in the province of Izmir (Turkey): Data envelopment analysis (DEA). J. Appl. Anim. Res., 29(1): 61-64. https://doi.org/10.1080/09712119.2006.9706572
CAPMAS (2021a). Central agency for public mobilization and statistics, statistical year book: Annual Bulletin of Statistics Livestock, Ref. No.71-22111-2021.
CAPMAS (2021b). Central agency for public mobilization and statistics, statistical year book: Annual Bulletin of the movement production, foreign trade and available for consumption of agricultural commodities, Ref. No.71-22123-2021.
Charnes A, Cooper WW, Rhodes E (1978). Measuring the efficiency of decision making units. Eur. J. Operat. Res., 2: 429-444. https://doi.org/10.1016/0377-2217(78)90138-8
Cobanoglu F (2013). Measuring the technical efficiency of cotton farms in Turkey using stochastic frontier and data envelopment analysis. Outlook Agric., 42(2): 125-131. https://doi.org/10.5367/oa.2013.0127
Coelli T, Perelman S (1996). Efficiency measurement, multiple-output technologie and distance functions: With application to European Railways. Liège: CREPP.
Coelli TJ (1996a). A guide to DEAP version 2.1: A data envelopment analysis (computer) program. CEPA working paper, no 8/96, Department of Econometrics, University of New England, Armidale, Australia.
Coelli TJ (1996b). Measurement of total factor productivity and biases in technological change in Western Australian agriculture. J. Appl. Econ., 11: 77–91. https://doi.org/10.1002/(SICI)1099-1255(199601)11:1<77::AID-JAE370>3.0.CO;2-H
FAO (2017). Food and agriculture organization of the United Nations, livestock production systems spotlight cattle and buffaloes, and poultry sectors in Egypt manual, https://openknowledge.fao.org/server/api/core/bitstreams/c3bdb8eb-0751-4491-970d-356e3a7ab99f/content.
Fare R, Grosskopf S, Norris M, Zhang Z (1994a). Productivity growth, technical progress, and efficiency change in industrialized countries. Am. Econ. Rev., 84(1): 66-83.
Fare R, Färe R, Fèare R, Grosskopf S, Lovell CK (1994b). Production frontiers. Cambridge University Press, Cambridge. https://doi.org/10.1017/CBO9780511551710
Farrell MJ (1957). The measurement of productive efficiency. J. R. Stat. Soc. Ser. A, III, pp. 253-290. https://doi.org/10.2307/2343100
Fawaz MM, El-Adawy RS, Ghanm AE (2017). The economic efficiency of dairy milk factories in Egypt by using DEA analysis. J. Sustain. Agric. Sci., 43(4): 165-174.
Gál T, Nagy L (2011). Application of multi-faceted efficiency analysis on dairy farms. In: 46th Croatian and 6th International Symposium on Agriculture, Opatija, Croatia: pp. 187-191.
Ghoneim E, El-Kaschab S, Omar S, Omran MF (2018). Comparative study among different dairy production systems in Egypt. Menoufia J. Anim. Poult. Fish Prod., 2(3): 39-56. https://doi.org/10.21608/mjapfp.2018.175658
Gul M, Yilmaz H, Parlakay O, Akkoyun S, Bilgili ME, Vurarak Y, Hizli H, Kiliçalp N (2018). Technical efficiency of dairy cattle farms in the Eastern Mediterranean region of Turkey by stochastic frontier analysis. J. Anim. Plant Sci., 27: 1689-1694.
Hassan F (2021). Data envelopment analysis (DEA) approach for assessing technical, economic and scale efficiency of broiler farms. Iraqi J. Agric. Sci., 52(2): 291-300. https://doi.org/10.36103/ijas.v52i2.1290
Lahmar M, Bouraoui R, Lachaal L, Toumi J (2003). Characterization of milk production systems in Tunisia: The case of Ariana region. Publ. Eur. Assoc. Anim. Prod., 99: 188-192. https://doi.org/10.3920/9789086865093_025
Lall P, Featherstone AM, Norman DW (2002). Productivity growth in the Western Hemisphere (1978–94): The Caribbean in perspective. J. Prod. Anal., 17: 213–231. https://doi.org/10.1023/A:1015008020851
Madau FA, Furesi R, Pulina P (2017). Technical efficiency and total factor productivity changes in European dairy farm sectors. Agric. Food Econ., 5(17): 8-14. https://doi.org/10.1186/s40100-017-0085-x
Malmquist S (1953). Index numbers and indifference surfaces. Stat. Work Operat. Invest., 4(2): 209-242. https://doi.org/10.1007/BF03006863
Ministry of Agriculture and Land Reclamation (2014). Economic affairs sector, livestock statistics, different numbers.
Mirmozaffari M, Zandieh M, Hejazi SM (2017). An output oriented window analysis using two-stage DEA in heart hospitals. 10th Int. Conference on Innovations in Science, Engineering, Computers and Technology Dubai, United Arab Emirates. 15242/DiRPUB.DIR1017018.
Nin-Pratt A, Johnson ME, Yu B (2012). Improved performance of agriculture in Africa South of the Sahara: Taking off or bouncing back? IFPRI Discussion Papers No. 1224, International Food Policy Research Institute (IFPRI), Washington DC, USA. https://doi.org/10.2139/ssrn.2185045
Omar MAE (2020). Technical efficiency and total factor productivity analysis of dairy cow breeds in Egyptian Governorates. Zagazig Vet. J., 48(3): 296-305. https://doi.org/10.21608/zvjz.2020.21599.1093
Rajasekar T, Deo M (2014). Is there any efficiency difference between input and output oriented DEA models: An approach to major ports in India. J. Bus. Econ. Policy, 1(2): 2375-0774.
Shkodra R, János FL, Kovács KN, Maloku D (2020). Technical efficiency of dairy farms in central kosovo. Int. J. Econ. Finan. Issues, 10(4): 258-263. https://doi.org/10.32479/ijefi.9630
Stokes JR, Tozer PR, Hyde J (2007). Identifying efficient dairy producers using data envelopment analysis. J. Dairy Sci., 90: 2555-2562. https://doi.org/10.3168/jds.2006-596
Syarifa H, Anandita AP, Arina NS (2020). Two-stage DEA analysis for measuring the performance efficiency of creative industry in East Java. In: Proceedings of the 3rd Asia Pac. Int. Conf. Manage. Bus. Sci., 135:19-26.
Terin M, Kulekci M, Yıldırım İ (2016). Measuring technical, allocative and economic efficiencies of dairy farms in western Turkey. Indian J. Anim. Res., 2016: 51. https://doi.org/10.18805/ijar.9294
Theodoridis AM, Psychoudakis A (2008). Efficiency measurement in Greek dairy farms: Stochastic frontier vs. data envelopment analysis. Int. J. Econ. Sci. Appl. Res., 1(2): 53-67.
Theodoridis AM, Ragkos A (2014). A restricted data envelopment analysis application to dairy farming. Data Envel. Anal. J., 1(2): 171-193. https://doi.org/10.1561/103.00000007
Tirkaso W, Hess S (2018). Does commercialisation drive technical efficiency improvements in Ethiopian subsistence agriculture. Afr. J. Agric. Resour. Econ., 13(1): 44-57.